- Digest of the Analysis -
A Condensation of the Detailed Analysis Pages
NOTE: All our Products, Designs, and Services are SUSTAINABLE, ORGANIC, GLUTEN-FREE, CONTAIN NO GMO's, and will not upset anyone's precious FEELINGS or delicate SENSIBILITIES
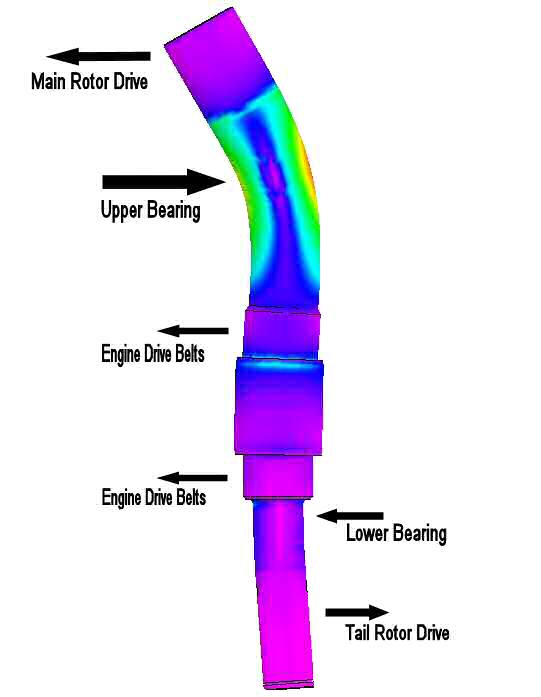
Figure 1
This page presents a digest-version of why the secondary shaft breaks in service. It is a summary of the results of the detailed system analysis (most of the remainder of this section of the website). For those who are interested in the facts supporting this summary, we recommend that you read through the detailed analysis pages. This summary page contains links to the various detail pages where a particular subject is covered.
It is important to understand that the load imposed on the cantilevered end of the secondary shaft by the main rotor drive causes the upper end of the shaft to deflect forward toward the mast. The effect of all the loads applied to the secondary shaft is shown in this picture, in greatly exaggerated form. For reference, the deflection at the top of the shaft shown here is about 0.007 inches (SEVEN thousandths).
This small deflection causes the surface of the shaft inside the bearing inner race to stretch and shrink a tiny amount (less than 0.0015", one and a half thousandths of an inch). The shrinking deflection (on the compressive side, toward the mast) causes microscopic relative motions between the shaft and the bearing inner race and increases the compressive stress concentrations at the edges of the bearing. That same back-and-forth motion occurs at the shrink-fit contact surfaces of the pressed-on sleeve used on 30mm shafts and on the earlier 35mm shafts.
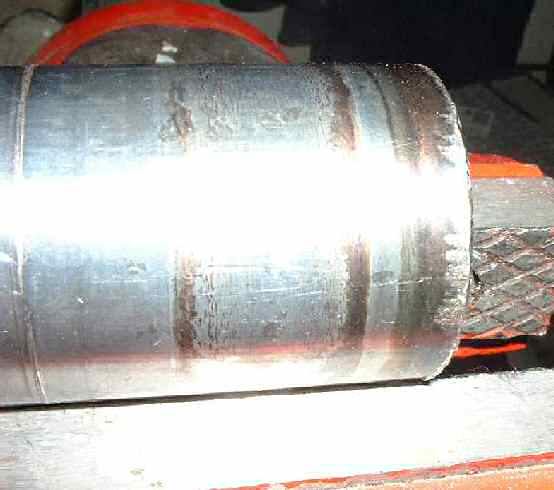
Figure 2
The combined effect of the tiny relative motions and the high compressive stress concentrations causes microscopic welding (during the compressive cycle) and tearing (during the tensile cycle) of the surface metal (the definition of fretting), which continuously removes metal from the shaft and bearing surfaces, erodes the finish, and ultimately reduces the shaft's fatigue strength to the point it can no longer support the applied loads. The discolored rings on the broken shaft in Figure 2 are fretted areas.
The fatigue fracture in this failed 35mm shaft originated from a severely-fretted area where the bearing spacer is pressed onto the shaft. Note that there is also fretting on the shaft where the edges of the bearing contact the shaft.
We have analyzed failed secondary shafts and bearings of both the 30-mm and 35-mm designs. From those analyses, it is clear that:
- the failures in both the 30mm and 35mm shafts are from bending fatigue, with the fractures originating from severely fretted areas of the shaft,
- the fretting occurs at a different location in the 30-mm design than in the 35-mm design, but both designs suffer from fretting,
- the factory 30mm and 35mm shafts have the same metallurgy, which we think is inappropriate for the application.
SHAFT LOADING FROM ProDrive™ BELT
It is important to understand why the ProDrive™ Belt system applies a much bigger fatigue load to the secondary shaft than the factory chain system does. This increased loading has been so vigorously denied that we have dedicated an entire page to explaining the increased loads.
Here is a summary. There are three reasons why the ProDrive™ belt system applies a substantially greater bending load (therefore deflection and fatigue stress) to the secondary shaft than the chain drive does:
- a smaller sprocket pitch diameter,
- a taller sprocket which applies the load higher on the shaft, and
- the preload required for the drive to operate correctly.
The combined effect of these three factors cause the ProDrive™ belt system to apply 33.3% greater bending loads to the secondary shaft, based upon the preload required for the assumed cruise power setting.
Add to that the fact that the ProDrive™ belt system is applying the same fatigue cycling load to the secondary shaft, whether it is idling or cruising, and the increased fatigue loading becomes very apparent.
The large overhung drive load produces the very small deflections (less than 0.0015”) under the bearing and the pressed-on collar, which, when combined with the unsuitable shaft metallurgy and hardness and the system torsional vibration, produce the fretting corrosion that destroys the fatigue properties of the shaft. The fact that the stresses, therefore the deflections, with the ProDrive™ belt system are greater simply accelerates the rate of shaft destruction.
We have done several detailed FEA studies of the 35mm shaft to determine stresses and deflections in the cruise and max power configurations (defined below). (REMEMBER to use your browser's BACK button to return here.) The following table shows, for the identical CRUISE and MAX power conditions (defined below), the stresses, deflections, and bearing loads applied to the FACTORY 35mm secondary shaft by the Factory Chain Drive and the ProDrive™ configurations. For the calculations summarized in this table, we used the most favorable (smallest) preload figures for the toothbelt system. Nominal and worst-case preloads make the loads (and deflections) bigger.
The Shaft Load Analysis clearly explains how these numbers were determined ("Belt" refers to the ProDrive™).
NOTE: These numbers, and the pages which explain where they came from, have all been updated to reflect the reduction of shaft loads caused by the newly-released Gates preload requirements.
| Description | Chain (max) | PD Belt (max) | Chain (cruise) | PD Belt (cruise) | |
| Max Shaft Stress | |||||
|---|---|---|---|---|---|
| 1 | Combined (Von Mises) | 15200 | 25100 | 12300 | 25100 |
| 2 | Axial, Normal | 14600 | 23200 | 11600 | 23200 |
| Shaft Deflection | |||||
| 3 | Upper End of Shaft | .0058 | .0096 | .0044 | .0096 |
| 4 | Upper Edge of Bearing | .0008 | .0014 | .0006 | .0014 |
| Bearing Loads | |||||
| 5 | Upper Bearing | 3209 | 4363 | 2591 | 4363 |
| 6 | Lower Bearing | 165 | 665 | 24 | 665 |
As shown in this table, note that in typical cruising flight, the ProDrive™ belt system roughly doubles the cycling deflection and the fatigue stress on the upper end of the secondary shaft, which dramatically increases the rate of shaft degradation. Note also that, with the toothbelt system, reducing power does not reduce the shaft stress and deflection.
(The stress and deflection numbers shown in the table are higher than those we published in the May '04 issue of Rotorheads. After writing that article, we discovered a small error in our definition of the problem within the FEA system. That error was reducing the effect of the applied loads.)
At this point, it is important to remind you that these numbers do not take into account the dynamics of the real system in operation. We have shown, in some depth that the actual dynamic loads on the secondary are quite a bit higher than those calculated from a static analysis. The high level of torsional vibration in the system accelerates the damage from fretting.
The increase in dynamic loading which the actual helicopter applies to the secondary shaft is confirmed by the testing which RWI is said to have done on a replica of the drive system, which used a waterbrake as the power absorber instead of the main rotor. That change in the basic system (waterbrake instead of rotor) causes a huge change in the system dynamics, not to mention the dissimilarity of the entire apparatus from the actual airframe. That test program supposedly went on for over 500 hours and produced no Secondary Shaft failures.
BOUNDARY CONDITIONS
The increased load and deflection applied by the ProDrive™ belt system is the source of a huge amount of smoke in the secondary discussion. Opinions abound, but the science is fairly straightforward. One major smoke-source is the fact that you can calculate a wide variety of shaft and bearing loads depending on the boundary conditions you choose.
The two major boundary conditions in this analysis are: (1) the power you assume is being transmitted to the main rotor and (2) the preload conditions for whatever transmission device you are analyzing.
1. POWER: This analysis of the secondary drive system is based on two typical operating conditions: max power and cruise power, defined as follows:
- MAX: the engine is producing 150 HP at 4250 RPM, with 12 HP being consumed by the water-pump, alternator and fan, and 15 HP consumed by the tailrotor, leaving 123 HP applied to the main rotor (typical for a max-performance takeoff or hover IF your engine can produce 150 HP).
- CRUISE: the engine is producing 120 HP at 4250 RPM, with 12 HP being consumed by the water-pump, alternator and fan, and 13 HP consumed by the
tailrotor, leaving 95 HP being applied to the main rotor (such as might be a typical cruise setting).
(You might not agree completely with the exact numbers. For example, to simplify the problem, we used 15 HP for the tailrotor in both cases. However, the numbers were used consistently, and are reasonable to establish the conditions for the study.)
2. PRELOAD: The term preload refers to the static tension required by any belt system (V-belts, flat belts and toothed belts) in order for it to transmit power (PRELOAD explained). The preload occurs either (a) when you install and assemble the system, or (b) when you engage a clutch mechanism which presses on a belt in the span between the driving and driven sprockets / pulleys. The side-load force you apply at midspan is NOT the preload; The deflection which the side-load produces is a crude measure of the preload.
Whereas there might be some preload in a chain system right after it is installed, there is no remaining preload after a few hours of operation (unless, of course, there is a tensioning device in the system). So the only tension forces in a chain system are the driving tension and the tension from centrifugal force (explained here and here).
A chain system or a belt system system transmits power by causing a bigger tension load in one span (the "tight" side) than the other (the "loose" side). The power transmitted is the result of the difference between the tension in the tight and loose spans.
The only tension in the loose side of a chain drive comes from centrifugal force, and at low speeds (as in the main rotor drive) it is small (less than 100 pounds). Because there is no preload in the chain system, the only source of cyclic bending load (other than the small centrifugal force) is the chain tension resulting from the torque applied to the secondary. Therefore, as you reduce throttle (torque), the cyclic bending load on the secondary decreases right along with it.
The requirement for preload establishes a fundamental difference between chain and belt systems. Because of preload, a belt system applies the same cyclic bending load to the shaft, whether it is idling or transmitting its maximum torque. Read that again.
The maximum transmitted torque establishes the minimum preload in a belt system, and that preload is there whether the system is running at max or stopped. That means that the total load on the shaft is essentially the same, no matter how much torque is being applied, because a belt system transmits torque by increasing the tension load in the driving side and relaxing the load in the loose side by about the same amount. The sum of both tensions remains essentially constant. Also, for the same applied torque, the belt system generates a greater tension load than the chain (as explained above). So the sources of the increased loading are quite clear and simple.
Bottom line: We think the detailed analysis shows that the factory 35-mm system is not adequate, either in material or in design, to survive the extra deflection and fatigue loading imposed by the Pro-Drive™ belt system. If you are using that drive system, it is up to you, the builder / operator, to apply whatever corrective measures you deem appropriate.