- Drive System Dynamic Properties -
Excitation Amplitude, Inertias, Torsional Rates
NOTE: All our Products, Designs, and Services are SUSTAINABLE, ORGANIC, GLUTEN-FREE, CONTAIN NO GMO's, and will not upset anyone's precious FEELINGS or delicate SENSIBILITIES
A properly-designed drive system can attenuate the severe torsional pulsing of a piston engine so that its effect on the driven components is diminished considerably.
Without full optimization, the driven components will see a measurable second-order component (the characteristic excitation from a 4-stroke, even-fire , 4-cylinder engine), but the measured amplitudes can be a small fraction of the mean. A drive system having desirable frequency response will not transmit any significant fraction of the higher order harmonics contained in the 4-cylinder sawtooth waveform.
On the other hand, an improperly-designed drive system can actually AMPLIFY these pulses many times over (as several disappointed PSRU designers have discovered).
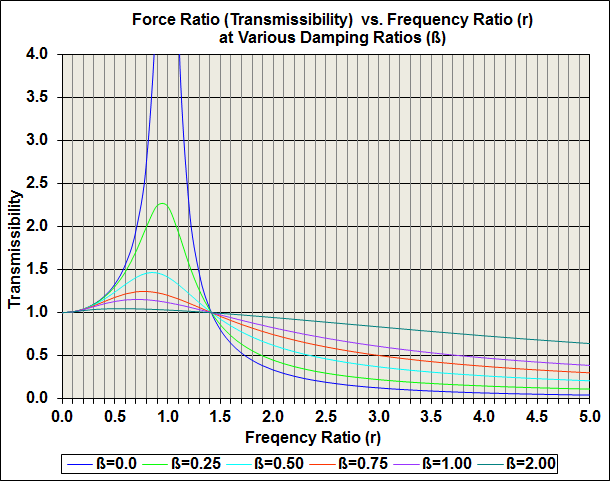
The pulse attenuation is all done by the magic of transmissibility, which is defined as the vibratory excitation force divided by the vibratory force applied to the driven system, or more simply, output amplitude divided by input amplitude (force ratio).
This graph shows how transmissibility changes with excitation frequency and with damping. The horizontal axis is frequency ratio (r, which is the excitation frequency divided by the resonant frequency). The symbol "β" indicates the amount of damping in the system. β=0 is none, β=2 is a lot.

Note that at r=1 (resonance) the system with no damping (β=0) allows the transmissibility to become huge (theoretically infinite).
Note also that below crossover, the more damping the system has, the less the input waveform will be amplified, but amplified it will still be. Above crossover, damping actually reduces the attenuation effect.
(If you have any questions about vibration basics, torsional vibration or transmissibility, it would be worthwhile to read those pages.)
We have proven the concept with the proprietary pulse-absorbing coupling system we developed for our line of propeller reduction gearboxes (see PSRU Products). These solutions exist in several different implementations.
Our solution to the RotorWay drive system problem follows the same general approach, with a different implementation.
ENGINE VIBRATION EVERYWHERE
The next picture dramatically demonstrates the level of engine excitation that is present throughout the airframe.
(This chart is from an article by Matthew Dock, produced from data taken with the ProBalancer™ measurement system. The article was published in the ROTORHEADS newsletter, and is reproduced here with their kind permission.)

Notice the huge energy spike labeled "F". It occurs at 8400 cycles per minute, which is the engine excitation (two torque spikes per revolution at 4200 RPM). The spike labeled "E" is at around 4250 cycles per minute and happens to correspond with the torsional vibration frequency of the secondary shaft (OK, 4285; the chart isn't that precise). Spikes "D" and "B" are the 1/2 harmonics of the excitations at "F" and "E". The vibration energy represented by "E" is the source of the stress which is failing the secondary shafts. The numbers from our dynamic frequency analysis confirm it. That data is presented on a subsequent page.
MAIN ROTOR POWER
In order to determine the maximum power (hence torque) applied to the main rotor system, we will assume the engine can produce rated power, and make some reasonable estimates of the power consumed by other subsystems.
First, it is conservative to assume that the cooling fan absorbs an essentially constant 7 HP. (Significantly more than that figure has been measured on engine dyno tests of similar fans.) Next, dyno measurements show that a coolant pump moving the amount of water necessary to keep an engine like the 162 cool consumes another 4 HP. If we assume that the battery has been recharged by the time takeoff begins, the estimated power consumption of the alternator is 1 HP. There are also losses from the efficiency factors of the various belt and chain drives (typically 92 to 98% efficient, depending on the type of drive) but we ignored those to be conservative. That makes the total estimated accessory load approximately 12 HP. At operating RPM, that load remains essentially constant.
At max power, it is reasonable to estimate that the tail rotor consumes 15 HP. (B.J. Schramm verified for me that a reasonable estimate of tail rotor power is 10%.) Summing these estimates results in a total support load of 27 HP (12 + 15). Subtracting that number from the advertised 150 engine HP results in a maximum of 123 HP applied to the main rotor.
The maximum available engine power decreases to approximately 75% at 25" MAP, 65% at 22" MAP, 55% at 20" MAP. From that, you can subtract the essentially constant 27 HP of the tail rotor and accessory load to get the main rotor drive power at other power settings.
INERTIAS and TORSIONAL RATES
In order to determine the frequency response of the system, it is necessary to determine the actual moments of inertia of the system components and the actual torsional rates of the interconnecting devices. The easy ones are described below. The more complex ones are on subsequent pages.
Main Rotor Blades
Using the weight of the rotor blades (42 lb. each) and the rotor disc diameter (25 ft), the mass moment of inertia (Jm) of the rotor can be approximated from the calculation for a long, slender object of rectangular cross section. That calculation yields a very large Jm of approximately 135 ft-lb-sec². Because of the magnitude of this value with respect to other system inertias, it would make little difference to the analysis if that estimate were off by 15% either way.
Secondary Shaft
The torsional rate of the secondary shaft is determined by the dimensions of the shaft between the upper end of the sprag-clutch drive and the bottom of the output sprocket. That rate for the 30mm shaft is about 751 lb-ft per degree, and for the 35mm shaft, it is about 1261 lb-ft per degree (what a difference 5mm makes).
Main Rotor Shaft
The torsional rate of the main rotor shaft is calculated from the diameter (1.75") and the effective torsional length of 36.3" (the distance from the top bolt in the drive hub to the blade attach mechanism on the head). The torsional rate of the main rotor shaft works out to about 443 lb-ft per degree.
It is interesting to note that with 1390 lb-ft of torque applied to the main rotor shaft (135 HP at 520 RPM) the torsional stress on the shaft is comfortably low (less than 15000 psi). With an aircraft weight of 1500 lb. and a load factor of 1.33, the tensile stress in the main rotor shaft is less than 1000 psi.

