- The Definitive V8's -
NASCAR Cup and FIA Formula One engines:
How do they compare?
NOTE: All our Products, Designs, and Services are SUSTAINABLE, ORGANIC, GLUTEN-FREE, CONTAIN NO GMO's, and will not upset anyone's precious FEELINGS or delicate SENSIBILITIES
THIS IS AN EXPANDED VERSION OF AN ARTICLE
BY Jack Kane WHICH APPEARED IN ISSUE 029 of
RACE ENGINE TECHNOLOGY MAGAZINE
NOTE: This article was originally published in 2008, and described Formula One and NASCAR CUP engines that were in use at the end of the 2006 season. Since that time, there have been vast changes in F1, and a few (NOTED within the article) in NASCAR. However, the technological insights remain valid with respect to current CUP engines.
INTRODUCTION
At the end of the 2006 competition season, both NASCAR Cup and FIA Formula One engines had reached pinnacles of crankshaft speed for their respective classes of motorsport: 10,000 and 20,000 RPM respectively. Although operating at these RPM levels has since been outmoded by regulation (NASCAR’s ever more stringent use of its ‘gear rule’ and the FIA’s 19,000 RPM rev limit introduced in 2007, reduced to 18,000 RPM for 2009), it seemed interesting to compare these very different engines to see what, if any, areas of commonality might exist.
BACKGROUND
In order to establish a backdrop for this article, the next few paragraphs give a brief sketch of the highlights of both engines.
A Formula One engine is certainly one of the most refined, developed, sophisticated pieces of machinery on the planet. It is a purpose-built, pure race engine, which, for the 2006 season, is a 90° V8 configuration, with 2.4 liters (146.4 cubic inches) of swept volume. There are fundamentally few restrictions on the implementation. Those few restrictions include the 2.4-liter, 90° V8 configuration with a 180° crankshaft, 106.5 mm bore spacing, 98 mm maximum bore, no variable-length inlet pipes, no metal-matrix composite materials, 58 mm minimum crankshaft height, and one injection nozzle per cylinder. The engines are DOHC, four-valve-per-cylinder layout with finger-followers and pneumatic valvesprings, with the ignition and fuel injection systems controlled by a sophisticated engine-management digital computer system. The engine weight is a minimum of 95 kg (209 lbs) and a center of gravity height restriction further influences the characteristics of the overall package.
The FIA required that each car must use the same engine for two consecutive practice-qualifying-race meetings or be penalized, so the design life of a 2006 engine was in the region of 1350 km (840 miles).
At the end of the 2006 season, Formula One engines typically used a 20,000 RPM redline (sometimes even throughout the course of a Grand Prix), and produced a peak power of about 755 BHP at above 19,000 RPM, with a peak torque of about 214 lb-ft (290 nm) at 17,000 RPM. Those levels of power and torque are 315 BHP/liter and 15.2 bar of BMEP respectively.
NASCAR "Cup" engines, by comparison, are the opposite end of the regulation spectrum. Not only are they more tightly restricted with regard to allowable parts, materials, dimensions, component minimum weights, etc, they must be derived from a (nominally) production-based, iron-block, 90° V8 with pushrod valve actuation, two valve wedge heads and a single four barrel carburetor. These engines are subject to various parameters imposed by NASCAR upon the four competing manufacturers in addition to those in the published rule book.
Of particular note, the Cup V8 is restricted to a 106.3 mm (4.185 inch) maximum bore, a 5.86 liter (358 cubic-inch) maximum swept volume, a 90° crankshaft, steel conrods, a single, valley-located camshaft, flat tappet cam followers of no more than 22.2 mm (0.875 inches) diameter, pushrod & rocker-arm valve actuation using steel pushrods and aluminum or steel rockers, (approved) aluminum cylinder heads with two valves per cylinder using steel helical valvesprings, a single four barrel carburetor based on a specified Holley model and a single, distributor- controlled ignition. Engine weight is approximately 260 kg (575 lbs).
Each car must, by regulation, use the same engine for one complete race meeting (practice, qualifying and the race) or be penalized. Races are typically 300 – 500 miles in length, so the design life of an engine is up to 800 miles.
At the end of the 2006 season, Cup engines made peak power of about 820-830 BHP at about 9000 RPM, and peak torque of about 520 lb-ft at about 7500 RPM. During a typical oval race, these engines continuously cycle between about 7000 and 10,000 RPM. I have it on very reliable authority that, if it were not for the final drive gearing rule, today’s (2014) Cup engines would be operating close to 11,000 RPM.
UPDATE (and another short rant):
As of the end of the 2014 NASCAR season, the CUP engines (358 CI, single 4-barrel, on GAS) had reached the vicinity of 890 HP at around 9000 RPM, and the gear rule limited their on-track speed to roughly 9500 RPM. Peak torque was up to over 540 lb-ft (BMEP of 227.5, torque ratio of 1.51).
(NOTE that the comparison table at the end of this article is based on 2006 performance levels of about 825 HP and 481 lb-ft.)
By way of comparison, lots of today's (2020) race engine builders get all excited and boastful about making 890 HP from a 410 cubic inch engine with individual-8-runner fuel injection, runing on METHANOL fuel.
It is extremely frustrating to me that this incredible CUP engine configuration has been legislated out of existence by the NASCAR braintrust. For the 2015 season, in the alleged interest of "reduced cost" and "better racing", these geniuses decreed that the CUP engines will be fitted with a "Tapered Spacer" located between the throttle body and the intake plenum. This spacer amounts to little more than a fancy restrictor plate, which limits the amount of air that the engine can ingest. That rule change immediately reduced the engine power to roughly 725 HP.
And while the NASCAR bureaucrat-clowns blather on about "reducing the cost of racing", this rule change required yet another vast expenditure of R&D money to develop a new engine package (combustion chamber, ports, manifold runners, plenum configuration, cam profiles, valve springs, etc. etc. etc) to optimize the performance of this new (different) engine package.
The engine companies, using dump-trucks-full of money and amazing skills, developed it from the 725 HP region back up to about 750 HP.
THEN, as if that didn't reduce the quality of racing enough, for the 2019 season, the governing wizards legislated an even smaller tapered spacer that allows only about 550 HP. ------ HEY GUYS, you already HAVE the XFINITY cars.
GOOD GRIEF, I can go to the corner car dealer and buy a STREET CAR with more power than that.
"Brain-Dead-Brian" strikes again! (Good thing I don't have a NASCAR driver license anymore)
COMPARISONS
On the basis of the ratio of BHP to displacement, one might argue that the Formula One engine is vastly superior (315 BHP per liter versus 140 BHP per liter). However, given the design latitude, which allows the Formula One engine to operate well at 20,000 RPM, perhaps there are better criteria by which to compare these engines.
The remainder of this article examines several other criteria to compare the performance of these two engines.
The table at the end of this article lists those criteria and other relevant numbers in a side-by-side format, with line numbers for each item, in order to make frequently-occurring references in the text easier to spot.
The basic dimension, weight, power and torque figures were obtained from engineers operating in the respective fields and supplied under condition of anonymity.
BMEP and MPS
Two of the most accepted performance-comparison yardsticks are Brake Mean Effective Pressure (BMEP, explained HERE) and Mean Piston Speed (MPS, explained HERE).
The BMEP of the Formula One engine at peak torque (table line 13) is 15.17 bar at 17,000 RPM, while the Cup engine produces a peak torque at BMEP of 15.12 bar (0.3 % less) at 7,500 RPM.
At peak power, the Formula One BMEP value (table line 22) is 14.6 bar while the Cup figure is 14.0 bar (4.1% less).
It is evident that producing 15.17 bar BMEP at 17,000 RPM and 14.6 bar at 19,250 RPM are remarkable achievements, given that the ratio between Friction Mean Effective Pressure (FMEP) and BMEP is much higher at Formula One than it is at Cup RPM.
However, it is astonishing that the Cup BMEP (remember, flat-tappet cam, pushrod / rocker arm, two-valves-per-cylinder, single carburetor) is only 0.3% less than the Formula One figure at peak torque, and only 4.1 % less than Formula One at peak power.
Even more revealing, at peak power RPM (table line 19) the Formula One engine MPS (table line 23) is 25.5 m/s (5025 ft/min), while that of the Cup engine is less than 3% lower at 24.8 m/s (4875 ft/min). At redline, the Formula One MPS is 26.5 m/sec, while the Cup MPS is a stunning 27.5 m/sec. To put those numbers in perspective, Professor Gordon Blair wrote (Race Engine Technology, issue 27) that 26.5 m/sec was the highest he had seen.
While being cautious with empiricisms, it is interesting to compare the nondimensional values of BMEP x MPS (bar x m/sec) at peak power (table line 24) and at peak torque (table line 15).
At peak power, the Cup engine value is only 7% less than the Formula One engine, again showing the remarkable performance extracted from this production-based V8. There is a bigger disparity at peak torque (nearly 9%), largely due to the greater spread between peak power and peak torque in the Cup engine (15% of redline versus 11% of redline for the Formula One engine).
PISTON MOTION
The net acceleration imposed on a piston is actually the sum of two independent curves: primary and secondary accelerations, shown in Figure 1 below and explained more fully HERE.
Figure 1 - Piston Acceleration Components
The primary acceleration (the blue line in Figure 1) is a first-order curve, based on crankshaft angular velocity squared, crank angle and stroke length, while the secondary acceleration (the green line in Figure 1) is a second order curve based on crankshaft angular velocity squared, twice the crank angle, and rod / stroke ratio.
While the primary component of piston acceleration has equal magnitude but opposite sign at top and bottom, the secondary component (that which is generated by virtue of the side-to-side motion of the conrod) has a positive sign at both top and bottom, as shown by the green line. Therefore at TDC the secondary peak adds to the primary peak, while at BDC, the secondary peak subtracts from the primary, as shown by the magenta line.
Figure 2 below is a graph of piston velocity and acceleration profiles for both engines at redline (table line 28), 20,000 and 10,000 RPM respectively.
Figure 2 - Piston Velocity and Acceleration Comparison
There are several items of interest here. The first (perhaps surprising) is that although the Formula One redline crankshaft speed is twice that of the Cup engine, the peak piston speed (table line 30) for the Cup engine is actually 5% greater than that of the Formula One engine at redline (44.6 m/sec vs. 42.4 m/sec), as shown graphically by the yellow (CUP) and teal (F1) lines in Figure 2.
Because the Formula One engine has a greater rod length / stroke ratio (2.56 vs. 1.91, table line 5), the Formula One peak piston velocity occurs at 79.5° before and after (b/a) TDC, (closer to mid-stroke) whereas, the Cup peak occurs at 76.5° b/a TDC.
The rod / stroke ratio noticeably affects the shape of the acceleration curve in the region of BDC. Note that the Formula One curve reaches peak negative acceleration at BDC, while the Cup curve is essentially flat for 26° either side of BDC.
Even though the center-to-center distance on the Formula One rod is only 102 mm (4.016 in), the large rod / stroke ratio (2.56) produces a relatively small secondary acceleration component. That is helpful, since with a flat-plane crankshaft, the secondary accelerations produce a considerable horizontal shake.
Assuming no piston pin offset, the maximum positive piston acceleration occurs at TDC. The reciprocating assembly exerts the greatest tensile force on the rod at TDC-overlap cycle because there is virtually no cylinder pressure to offset the acceleration force, whereas at TDC-combustion, the cylinder pressure is approaching its maximum value of roughly 85 – 90 bar, which will completely cancel the tensile acceleration force and produce a large compressive load on the rod.
The large difference in Peak Piston Acceleration (PPA) between Formula One and Cup is in the direction one would expect given the crankshaft speed values. At redline, the Formula One PPA is 10,622 g compared to the Cup value of 5821 g. Note that the PPA at redline (table line 31) for the Formula One engine is 82% greater than that of the Cup engine, while both the peak and mean piston speeds (lines 29 & 30) are fairly similar for both engines.
However, comparing the force levels that those acceleration values produce is revealing. The Formula One piston package (pistons, rings, piston pin, circlips) weighs roughly 295 grams (lines 33-35). At 20,000 RPM, the PPA causes a tensile load on the piston pin bore of the conrod (table line 41) of 10622 g x 0.295 kg = 3133 kg (6894 lb), and the piston package plus the reciprocating portion of the conrod exerts a 4036 kg (8880 lb) tensile load on the cross section of the rod beam (table line 42) at the CG (approximately 1.23 inches from the big end center).
In comparison, the Cup piston package (pistons, rings, piston pin, circlips) weighs about 500 grams (lines 33-35). At 10,000 RPM, the PPA causes a tensile load on the piston pin bore of the conrod (table line 41) of 5821 g x 0.50 kg = 2911 kg (6403 lb), only 7% less than the Formula One value. Similarly, the piston package plus the reciprocating portion of the conrod exerts a 3725 kg (8196 lb) tensile load on the cross section of the rod beam (table line 42) at the CG (approximately 1.66 inches from the big end center), only 8% less than the Formula One engine.
CONNECTING ROD COMPARISON
In order to do a rough comparison of the conrod stress and deflection levels, I generated estimated models of the two conrods. Since I have not been privileged to view conrods from either engine, I used some known data about the Cup and Formula One rods (length, weight, material, crankpin diameters, and piston pin diameters) plus a few educated guesses.
The Cup rod material is required be steel, and I have been told that the 300 ksi, very-high toughness 300-M alloy is used frequently, although the use of a high nickel, high cobalt, very low carbon 350 ksi maraging alloy has been hinted at. It has an ‘H’-beam configuration, a ballpark centerline length of 157.5 mm (6.2 inches), crankpin diameter of 47 mm (1.85 inches) , piston pin diameter of 20 mm (0.787 inch) , and a minimum specified weight of 525 grams.
It has been publicly stated by one well-known supplier of such rods that a suitably strong and stiff rod can be made at well below the minimum weight. Therefore, it is safe to reckon that material has been added to the rod where it can be of most benefit.
One of the areas of greatest deformation under load is the ovalling of the piston pin bore under tensile load, which pinches the piston pin and thereby adds to the friction losses. A lighter beam section is adequate for the applied tensile, compressive and buckling loads. Therefore, to reach the minimum weight of 525 grams, I guessed the existence of stiffening ribs around the piston pin bore.
The same reasoning was applied to the Formula One rod. I have been told that the Formula One rod is an ‘H’-beam layout in titanium, with a centerline length of 102 mm (4.016 inches), 34 mm (1.34 inches) crankpin diameter, 18 mm (0.709 inches) piston pin diameter, and a stated weight in the 285 gram vicinity.
Since the stiffness of titanium alloys is roughly half that of steel, I assumed the use of the high strength, high-modulus 6Al-2Sn-2Zr-2Mo-2Cr-0.25Si Alpha-Beta titanium alloy to design our estimated Formula One rod. That material has a high Young’s modulus (17.7 million) compared to other titanium alloys, and a middle of the road density, which allows for lots of material (good stiffness) while maintaining low weight. The existence of piston pin stiffening ribs was also assumed for this rod, for the same reasons as for the Cup rod.
The resulting estimated designs are shown in the following picture (Figure 3). Having those estimated models allows the estimation of the reciprocating (small end) and rotating (big end) weight components of each rod, leading to a comparison of the loads applied to the rod beam and crankpin by the two engines.
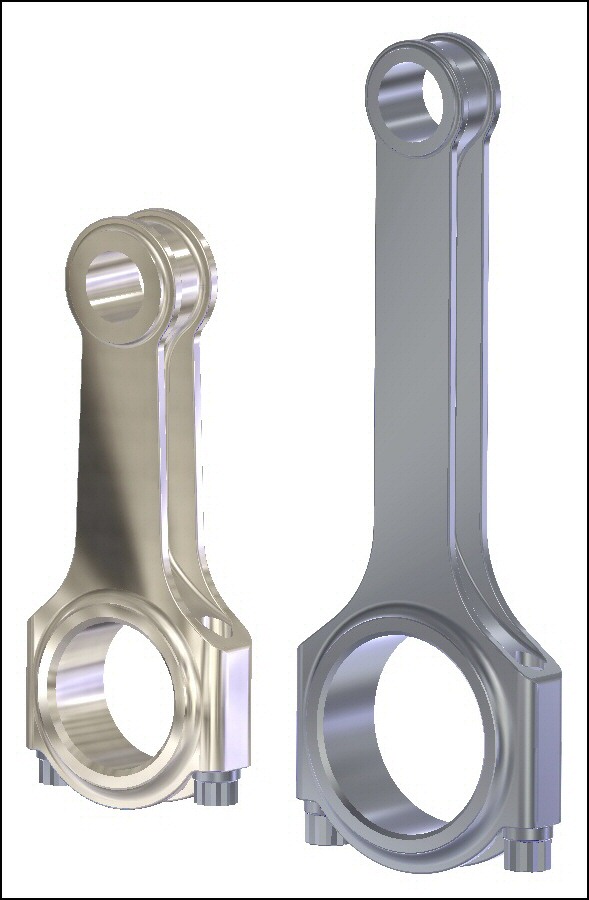
Figure 3 - Estimated F1 and Cup Rods
Although the applied tensile loads are greater in the Formula One engine (table line 42), the calculated tensile stress on the rod beam (table line 44) is substantially less in the Formula One rod because of its larger cross sectional area (0.429 in² vs. 0.299 in² in the CAD models). The lower stress level in the Formula One rod reduces the TDC stretch of the less stiff titanium, and helps the rod live with the much lower ultimate, yield, and endurance limit of the titanium material as well.
However, the beam tensile and compressive stresses on both rods are not nearly as great as the stresses around the pin eye and the cap ribs. Within the time constraints placed on the generation of this article, I was able to do a few FEA studies of both rods. All the studies assumed extreme-strength, 8 mm rod bolts and used 8000 pounds of preload in each bolt, to provide a substantial cap-to-rod clamping margin.
Those studies showed that
- At max compressive load, the stresses and buckling margins in both rods are acceptable (although “I” beam rods have considerably more buckling margin at the same loads than “H” beam rods of similar cross section),
- At max tensile load, the stresses are acceptable and have margins from the respective endurance limits suitable for their design lives, and
- The stresses in the rod bolts are very high (over 180,000 psi) but with such a high preload, they are non-cycling, so probably not subject to fatigue failure.
The studies also showed that with both rods, more optimization in terms of moving material from lower-stressed areas to higher-stressed areas would yield more rigidity and lower stresses in critical areas. The two FEA pictures (Figures 4 and 5) show the stresses for the assumed Formula One and Cup rod configurations.
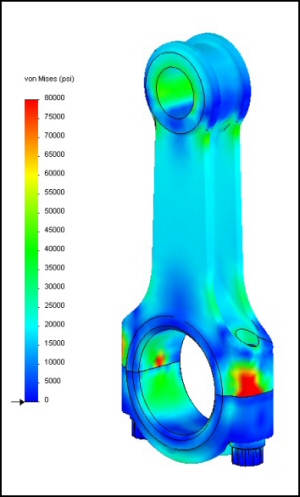
Figure 4 - F1 Rod FEA |
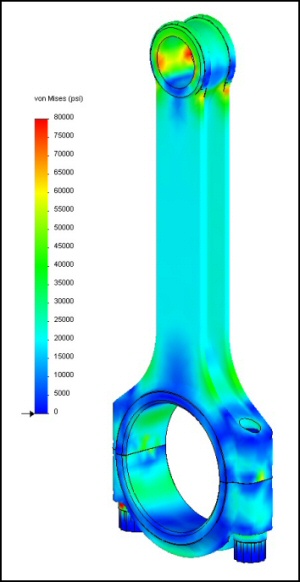
Figure 5 - Cup Rod FEA |
IN SUMMARY
Stepping back to fundamentals for a moment, we know that the potential power any engine can produce is directly dependent on two factors:
- The mass of air it can ingest per second, and
- The BSFC it can coax from the fuel.
The mass airflow parameter encompasses elements including bottom-end design (RPM capability), runner, port, valve and chamber design, cam profile and valvetrain design, and others.
The BSFC parameter encompasses elements including the heat content of the fuel, best-power air-fuel ratio, thermal efficiency, mechanical efficiency, mixture homogeneity, mixture motion, chamber design, combustion quality, and others.
Mass airflow is dependent on:
- Air density and
- Volumetric efficiency (VE).
At 100% VE, the volume of air a four-stroke engine can ingest is proportional to: RPM x Displacement ÷ 2. To express that potential airflow, I will define the term Potential Airflow Number (PAN) as:
PAN = (rpm / 1000) x (displacement ÷ 2)
It is revealing to examine the relationship between power produced and potential airflow. Using the potential airflow as expressed by the PAN, I can generate an empiricism which clearly expresses that relationship. Let's name it Engine Performance Coefficient (EPC) because it provides another basis (in addition to BMEP, BSFC, MPS and BHP/Cubic-Inch) for comparing one engine to another. That factor (EPC, table line 9) encompasses all the engine design variables .
EPC = Peak Power / PAN
Combining terms and rearranging the equation produces:
EPC = (Peak Power x 2000) / (rpm x displacement)
At peak power, the Formula One engine EPC is:
EPC = 755 x 2000 / (19,250 x 146.46) = 0.536
Likewise at peak power, the NASCAR Cup engine EPC is:
EPC = 825 x 2000 / (9000 x 357.65) = 0.513
It is very revealing to consider that the EPC figure for the Cup engine is only 4.3% less than the F1 engine. Again, remember the limitations imposed on the Cup engine. Some of the most severe are the pushrod / rocker arm valvetrain, two-valves per cylinder, and the single carburetor.
Less obvious, but very significant are limitations such as the 0.875 flat tappet diameter. That restriction severely limits the lifter velocity (inches / degree) that can be attained. However, since the real goal is to achieve velocity at the valve, the Cup engine people have neatly sidestepped that limitation with large base-circle cam lobes, immense rocker ratios, and very stiff pushrods and rocker arms.
Considering the restrictions, the small 4.3% difference in EPC between Formula One and Cup gives a real insight into just how clever the Cup engine people really are.