- Piston Motion Basics -
Travel, Velocity, Acceleration, Vibration
NOTE: All our Products, Designs and Services are SUSTAINABLE, ORGANIC, GLUTEN-FREE, CONTAIN NO GMO's, and will not upset anyone's precious FEELINGS or delicate SENSIBILITIES
The crankshaft, connecting rods, wristpins and pistons in an engine comprise the mechanism which captures a portion of the energy released by combustion and converts that energy into useful rotary motion which has the ability to do work. This page describes the characteristics of the reciprocating motion which the crankshaft and connecting rod assembly imparts to the pistons.
A crankshaft contains two or more centrally-located coaxial cylindrical ("main") journals and one or more offset cylindrical crankpin ("rod") journals. The V8 crankshaft pictured in Figure 1 has five main journals and four rod journals.
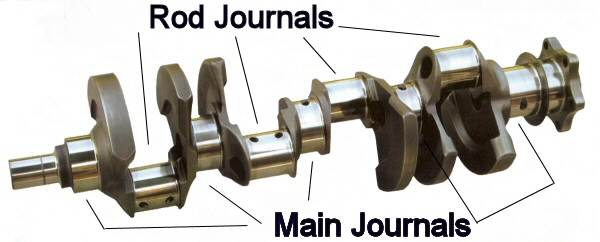
Figure 1
The crankshaft main journals rotate in a set of supporting bearings ("main bearings"), causing the offset rod journals to rotate in a circular path around the main journal centers, the diameter of which is twice the offset of the rod journals. The diameter of that path is the engine "stroke", which is the distance the piston moves from one end to the other end of its cylinder. The big ends of the connecting rods ("conrods") contain bearings ("rod bearings") which ride on the offset rod journals.
For details on the operation of crankshaft bearings, see our ENGINE BEARINGS page. For details on crankshaft design and implementation, see our CRANKSHAFT DESIGN page.
The small end of the conrod is attached to the piston by means of a floating cylindrical pin ("wristpin", or in British, a "gudgeon pin"). The rotation of the big end of the conrod on the rod journal causes the small end, which is constrained by the piston to be coincident with the cylinder axis, to move the piston up and down the cylinder axis.
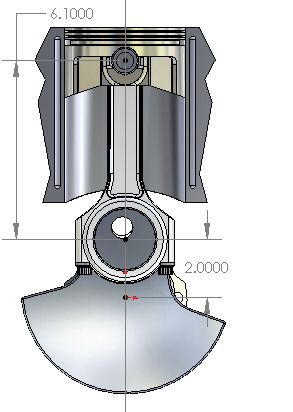
Figure 2: TDC
The following description explains the not-so-obvious characteristics of the motion which the crankshaft / conrod mechanism imparts to the piston.
Figure 2 shows a sectional end-view of a Crankshaft, Connecting rod and Piston (CCP) mechanism when the piston is at the furthest extent of its upward (away from the crankshaft) travel, which is known as the top dead center (TDC) position (even in upside-down and horizontal engines).
The furthest extent of the piston's downward (toward the crankshaft) travel is known as the bottom dead center (BDC) position.
In the CCP mechanism shown, the crankshaft has a 4.000 inch stroke and the center-to-center length of the conrod is 6.100 inches. The rod to stroke ratio (R / S) is the center-to-center length of the conrod divided by the stroke. In this example, the R / S is 6.100 / 4.000 = 1.525.
This ratio is important because it has a significant influence on piston motion asymmetry (explained below), and on the resulting vibration and balance characteristics, as well as certain performance characteristics.
(NOTE: If you believe that installing longer connecting rods will increase an engine's stroke, there's no need for you to go any further on this page, or on this entire site, for that matter.)
For purposes of this discussion, the extended centerline of the cylinder bore intersects the center of the crankshaft main bearing, and the wristpin is coincident with the cylinder centerline (defined as zero wristpin offset). Although the following descriptions apply strictly to configurations with zero wristpin offset, the general observations apply to nonzero offset configurations as well.
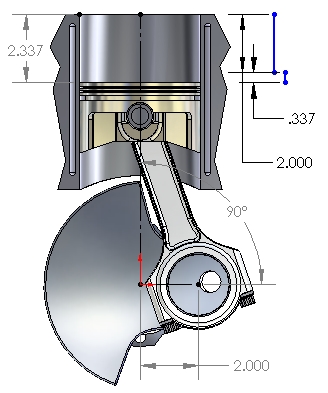
Figure 3: 90° After TDC
It is important to understand that the motion of the piston within 90° before and after TDC is not symmetric with the motion 90° before and after BDC. The rotation of the crankshaft when the crankpin moves from the TDC position to 90° after TDC (and from 90° BTDC to TDC) moves the piston substantially MORE than half the stroke value. Conversely, the rotation of the crankshaft from the 90° ATDC (or 90° BBDC) to the BDC position moves the piston substantially LESS than half the stroke value. This asymmetry of motion is important because it is the source of several interesting properties relating to the operation, performance and longevity of a piston engine.
Figure 3 shows the subject CCP with the crankpin rotated 90° past TDC. Note that the piston has moved over 58% of its total stroke (2.337 inches). That is because in addition to the 2.000" (half-stroke) downward motion of the crankpin (motion projected onto the vertical plane), the crankpin has also moved horizontally outward by 2.000", putting the conrod at an angle with the vertical plane.
The cosine effect of the angle betwween the conrod axis and thevertical plane shortens the projected length of the conrod in the vertical plane by 0.337", from the actual 6.100" to the 5.763" shown in the picture. This dynamic "shortening" of the conrod has the effect of adding 0.337" of downward motion to the 2.000" of downward motion imparted by the crankpin rotation, as illustrated by the two vertical blue lines in Figure 3.
For anyone interested, here is how that "effective length" is calculated. The actual length of the conrod { 6.100 inches }, the projected length in the vertical plane, and the 2.00 inch horizontal travel caused by the rotation of the crankshaft form a right triangle in which the 6.100 conrod length dimension is the hypotenuse and the 2.00" half-stroke is one leg of that right triangle. The Pythagorean Theorem {high school geometry} states that for a right triangle, the hypotenuse equals the square root of the sum of the squares of the two perpendicular legs, stated in equation form as:
A² + B² = C²
where A is one leg of the right triangle, B is the other leg, and C is the hypotenuse.
Solving that equation for the unknown leg (the conrod "effective length") provides the following solution:
B = SQRT( C² - A²)
or
SQRT ( 6.1²-2.0²) = 5.763
Note that in crank rotation positions other than 0, 90, 180 and 270, the calculation is slightly more involved, requiring the calculation of the angle between the vertical plane and the conrod centerline, then multiplying the conrod centerline length by the cosine of that angle (again, simple high school trigonometry).
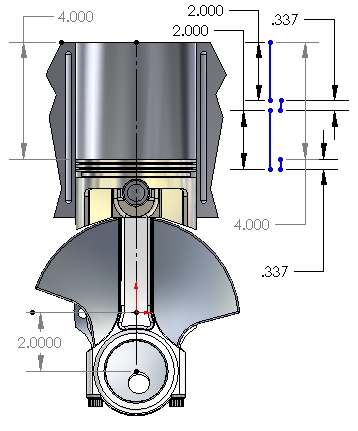
Figure 4: 180° After TDC
Now, back to piston motion.
Since the piston has already moved about 58% of the stroke during the first 90° of crank rotation, it stands to reason that during the next 90° of crank rotation (to BDC) the piston will only have to travel the remaining 42% of the stroke to reach BDC, as shown in Figure 4.
The reason is that as the crank rotates toward BDC, the crankpin also moves horizontally back toward the center of the cylinder and "restores" the effective length of the rod. That cosine-effect "lengthening" of the conrod opposes the downward movement of the piston, subtracting 0.337 from the half-stroke of vertical motion produced from 90° to BDC. That effect is illustrated by the lower two vertical blue lines in Figure 4.
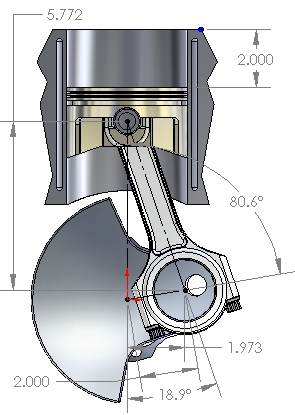
Figure 5: Half-Stroke
Clearly then, when the crankshaft is in any position other than TDC or BDC, the axis of the connecting rod is no longer parallel to the centerline of the cylinder (the line along which the piston, wristpin and small end of the rod are constrained to move). Therefore, the "effective length" of the conrod at any point other than TDC or BDC is the actual conrod center-to-center length multiplied by the cosine of the angle between the rod and the cylinder centerline. It is clear that the dynamic change in the conrod effective length adds to and subtracts from the purely sinusoidal motion caused by crankpin rotation.
Figure 5 shows that, with the R / S in this CCP example (1.525), the half-stroke position of the piston occurs at about 81° crank rotation after TDC. The rapid change in volume of the combustion chamber after the TDC position has some interesting ramifications with respect to the P-V diagram and thermal efficiency (discussed on a different page).
PISTON VELOCITY
Velocity is, by definition, the instantaneous rate of change of position with respect to a reference variable. Piston velocity is simply a measurement of how rapidly the piston position is changing with respect to the reference variable. This rate of change of position is commonly known as "the first derivative of the position curve". (For a more thorough explanation of velocity and acceleration and derivatives, please see our VELOCITY and ACCELERATION page, or any basic calculus text, such as ref-1:2:39) .)
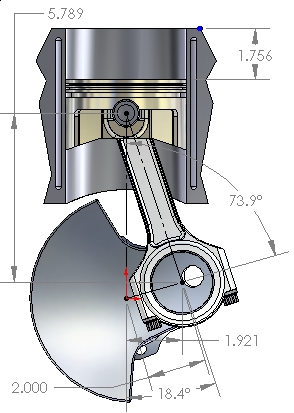
Figure 6: Maximum Velocity
For simplicity, I have chosen to use crank rotation as the reference for these graphs. Typically, one is interested in the rate of change of piston position with respect to time, which would yield velocity in inches or feet per second, and the value would depend on the rotation speed of the crankshaft.
It is obvious that, as the piston moves from TDC to BDC and back, the velocity is constantly changing, and that the piston velocity is zero at TDC and BDC. The value and location of the maximum velocity with respect to crank rotation (the maximum slope of the position curve) are influenced by the R / S ratio.
Figure 6 shows the location of the point of maximum piston velocity, in crankshaft degrees before and after TDC, for the configuration used in this example (4-inch stroke, 6.100" rod length, R / S = 1.525). At that position (73.9° before and after TDC), the piston has traveled only 43.9% (1.756") of the total stroke (4.000"). For this configuration (R / S = 1.525), at 4000 RPM, the peak piston velocity is 4390 feet per minute. For a longer stroke with the same R / S, the location of peak piston velocity would be the same, but the actual value of that velocity would be higher (at the same RPM, of course).
Figure 7 shows graphs of piston position and of instantaneous velocity as a function of crankshaft rotation. The blue line ("position") shows piston location (as a % of stroke) at any point during one rotation of the crankshaft. The blue line is artificially oriented so as to show position in an intuitive sense (top, bottom), therefore the "-" signs shoud be ignored with respect to position. The green velocity line shows the relative speed of the piston (as a % of maximum) at any point. Velocity with a "plus" sign is motion TOWARD the crankshaft; velocity with a "minus" sign is motion AWAY from the crankshaft.
Note again that at TDC and again at BDC, the piston velocity is zero, because the piston reverses direction at those points, and in order to change direction, the piston must be stopped at some point.
Note also that the position plot (blue) shows that, for this R / S ratio ( 1.525 ), the 50% stroke positions occur at approximately 81° before and after TDC (as illustrated in Figure 5 above). The velocity plot (green line) shows the maximum piston velocities occur at about 74° before and after TDC (as illustrated in Figure 6 above). The velocity line also shows that the piston velocity at any rotation point from TDC up to the maximum velocity is greater than at the same number of degrees before BDC. For example, compare the velocity at 30° after TDC (62%) with the velocity at 30° before BDC (34%).
Figure 7
The profile of the velocity curve, and therefore the location of the maximum velocity, are both influenced by the R / S ratio. As the rod gets shorter with respect to stroke (a smaller R / S ratio), two interesting things happen which can have important effects on cylinder filling: (1) the point of maximum piston velocity moves closer to TDC, and (2) the piston moves away from TDC faster, creating a stronger intake pulse. The location of maximum piston velocity influences the design of camshaft lobe profiles (especially intake) in order to optimize the intake event in a particular speed range, and can have an influence on the intake characteristics with regard to the strength and shaping of the intake pulse for ram tuning.
MEAN PISTON SPEED
There is another piston velocity which is used more as a "rule-of-thumb" in engine evaluations. It is called "mean piston speed", which is a calculated value showing the average velocity of a piston at a known RPM in an engine having a known stroke length.
Keeping in mind that every crankshaft revolution, the piston travels a distance equal to twice the stroke length, then Mean Piston Speed (MPS) is calculated by:
MPS (ft per minute) = RPM x 2 x stroke (inches) / 12 (inches per foot) = RPM x stroke / 6
The Mean Piston Speed at 4000 RPM for the example 4.000 inch stroke engine is:
MPS (ft per minute) = 4000 x 4 / 6 = 2667 feet per minute.
For purposes of rules of thumb, it is generally agreed that for an engine in aircraft service, 3000 fpm is a comfortable maximum MPS and experience has shown that engines having an MPS substantially exceeding that value have experienced reliability issues. Note that R / S has no influence on MPS, although it does affect PEAK piston speed (4390 fpm for the example engine {R / S = 1.525} at 4000 RPM).
PISTON ACCELERATION
The force it takes to accelerate an object is proportional to the weight of the object times the acceleration. From that it is clear that piston acceleration is important because many of the significant forces exerted on the pistons, wristpins, connecting rods, crankshaft, bearings, and block are directly related to piston acceleration. Piston acceleration is also the main source of certain external vibrations produced by an engine.
Crankshaft torsional vibration is caused mainly by combustion forces, combined with piston acceleration forces when those get large (think high RPM). Torsional vibration is discussed separately on our TORSIONAL VIBRATION page.
Acceleration is, by definition, the first derivative of the velocity curve and the second derivative of the position curve. In other words, acceleration is the (instantaneous) slope of the velocity curve at any given point along the reference axis. More simply, it is a measure of how rapidly velocity is changing, usually expressed with reference to time. If velocity does not change with respect to the reference, there is no acceleration. Conversely, if velocity changes very rapidly with respect to the reference, there is a large acceleration. (See our VELOCITY and ACCELERATION page for a more thorough explanation.)
It is clear from Figure 7 that the piston velocity is constantly varying with respect to a constant change in angular crankshaft position (rotation). Therefore, In order to move from the zero-velocity point (TDC) to the maximum velocity point, the piston must be subjected to a large acceleration function which varies with the angular rotation of the crankshaft.
Figure 8 shows the acceleration, velocity and position plots for the example CCP under discussion. (All numeric values presented are for the 1.525 R / S in this example.)
NOTE that, for a given engine configuration, the magnitudes of velocity and acceleration values depend on the instantaneous crankshaft angular velocity (RPM). Therefore, in the following charts, velocity and acceleration curves are shown as a percent of the maximum value that will occur at any RPM. The magnitudes will change with RPM but the percentages of peak do not change.
Figure 8
The maximum positive value of acceleration (100%) occurs at TDC. Between TDC and maximum piston velocitty (74° in this case), acceleration is positive but decreasing toward zero (the piston velocity is still increasing but less rapidly). At maximum piston velocity (74° at this R / S ), the piston stops speeding up and begins to slow down. At that point, the acceleration changes direction (from a "plus" number to a "minus" number), and in so doing, momentarily passes through zero.
At this R / S, the maximum negative acceleration does not occur at BDC, but about 40° either side of BDC. The value of this maximum negative acceleration is only about 53% of the maximum positive acceleration seen at TDC. The acceleration at BDC is only 49% of the TDC maximum. The acceleration from max piston velocity (74°) to BDC is negative, and that acceleration is slowing the piston to zero velocity. Therefore, it might be (incorrectly) called deceleration. However, that same negative acceleration is applied to the piston after BDC and is causing its velocity to increase.
The zero acceleration point occurs (by definition) at the point of maximum piston velocity (74° B/A TDC), where velocity is reversing direction, but the rate of change of velocity (the slope of the curve) is zero.
The somewhat odd shape at the bottom of the total piston acceleration (magenta) curve is the result of the fact that the total piston acceleration is the sum of several orders of acceleration, the first two being the most significant. The two major orders which combine to produce this total acceleration profile are important because they can produce significant vibration challenges to the engine designer (covered in CRANKSHAFTS).
Figure 8 shows the same total piston acceleration curve (magenta line) shown in Figure 7, along with the two significant orders of piston accelerations (first and second order) which combine to produce that curve. The total piston acceleration curve (magenta) is the sum of the two separate acceleration orders: primary (blue) and secondary (green).
Figure 8
As explained in Piston Motion above, the piston motion in the first 90° of rotation consists of the sum of the effect of the half-stroke motion of the crankpin projected onto the vertical plane (2.000") and the effect of the apparent 0.337" "shortening" of the rod length projected onto the vertical plane. The second 90° of rotation also produces a half-stroke motion in the vertical plane, but the cosine-effect lengthening of the conrod in the vertical plane produces 0.337" motion which subtracts from the half-stroke.
The primary acceleration (blue line) is the result of the piston motion produced by the component of crankpin movement projected onto the vertical plane. This curve is a sinusoid which repeats once per revolution of the crankshaft (first order) and comprises the majority of the acceleration. Note that the primary acceleration curve crosses zero at the 90° rotation points and peaks at TDC and BDC.
The secondary acceleration (green line) is the result of the additional piston motion caused by the cosine-effect dynamic effective-length-change of the conrod. This motion adds to the piston movement between TDC and the max velocity point and subtracts from the piston motion between the max velocity point and BDC. This curve is also sinusoidal and repeats twice per crankshaft rotation (second order) and crosses zero at the 45°, 135°, 225° and 315° rotation points. The total piston acceleration at any point is the sum of the values of the primary and secondary acceleration curves.
Contemporary piston engines tend to have R / S ratios in an approximate range of 1.5 to 2.0. Note that a rod / stroke ratio less than 1.3 is, for practical applications, not possible due to physical constraints such as the need for piston rings and a wristpin, sufficient piston skirt length, and the inconvenience of having the piston not contact the crankshaft counterweight, not to mention the excessive side load such a small ratio would produce.
Here are two practical examples comparing the effects of R / S on acceleration and velocity. Engine 1 ("E1") is a Lycoming IO-360 (or IO-540) having a conrod length of 6.75" and a stroke is 4.375", for a R/S ratio of 1.543, which is close to the low end of the spectrum in contemporary design. At the other end of that spectrum, Engine 2 ("E2") is a typical (circa 2007) 2.4 liter, 755 HP Formula-1 V8 engine, in which the conrod length is 4.010" ( what your average race-engine mechanic would call a "very short rod"). However, the stroke in that F1 engine is 1.566", which produces a very large R / S ratio of 2.56. The effects of those two extreme R/S ratios is shown in Figure 9 below
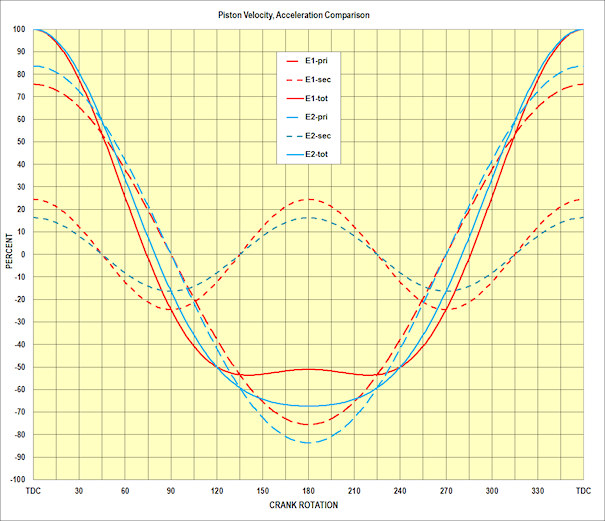
Figure 9
In Figure 9, the red lines represent the piston accelerations (in % of peak-total) for Engine 1 (the 1.543 R/S): Primary (large dashes), Secondary (small dashes) and Total (solid). The blue lines show the piston accelerations for Engine 2 with the 2.560 R/S (in % of peak-total): primary ( large dashes), secondary (small dashes) and total (solid line).
It is quite clear from that graph that the engine with the very small R / S ratio of 1.543 (the "long" 6.75 inch conrod) has a substantially lower peak primary acceleration (76 vs 84%) but a higher secondary acceleration (24 vs 16%), and the very distinct acceleration reversal around BDC, confirming the substantial secondary vibration component.
Compare that to the large 2.56 R / S ratio (the "short" 4.01 inch conrod) blue lines, showing a substantially higher peak primary acceleration (84 vs 76%) but a lower secondary acceleration (16 vs 24%), and a total acceleration curve which is closer to symmetric, confirming the substantially-reduced secondary vibration component.
Figure 9 also clearly demonstrates the absurdity of discussing conrod length as an absolute.
Figure 10 is a chart listing the main effects of R / S ratios varying from 1.40 to 2.55. I chose R / S = 2.0 to be the reference point for these comparisons of Vmax %, PPA max-positive %, and PPA max-negative % because that ratio is the lowest at which the maximum negative acceleration occurs at BDC. Notice that at R / S ratios above 2.00, the acceleration curve becomes more symmetric, but the peak velocity does not change much at all.
Figure 10
The Effects of R / S Ratio
NOTE: All the calculations and explanations on this page and the next page assume zero piston pin offset. A non-zero offset will slightly alter the calculations, SLIGHTLY being the operative word.
The vibratory effects that these primary and secondary forces produce is explained on the "Next Subject" page.