- Fatigue Failures in the Secondary Shaft -
A Subtle Combination of Drive Loads and Vibration
NOTE: All our Products, Designs, and Services are SUSTAINABLE, ORGANIC, GLUTEN-FREE, CONTAIN NO GMO's, and will not upset anyone's precious FEELINGS or delicate SENSIBILITIES
A previous page showed that the high nominal fatigue loads which the ProDrive™ system imposes on the secondary shaft (25,100 psi) are less than the application-specific endurance limit (EL) for the shaft (38,200 psi). In fact, that margin is a safety factor of 1.52 (not great, but not bad either). So why are the shafts failing? A combination of two factors: fretting and dynamic loads. This page explains the cause, and shows pictures of the result.
(If you have not yet read the Basics page on Fretting, we recommend you do so before continuing here.)
The literature on fretting corrosion clearly shows that the endurance limit values of metals with fretted or corroded surfaces decrease to as little as 25% of their uncorroded values, which would take the calculated shaft EL value of 38,200 psi down to less than 10,000 psi. However, metqallurgical testing has revealed that the endurance limit bottoms out at around 20,000 psi.
The rate of fretting is influenced by the magnitude of the microscopic relative motions between the mating parts, which partially explains why the rate of fretting in chain-drive shafts is less than that in belt-drive shafts: lower bending stress produces lower deflections. The other reason is that, as the FEA results show, the belt-drive causes greater compressive stress concentrations where the bearing is shrunk onto the shaft and subjected to high bending loads. These factors, coupled with the dynamic loading, can cause the fretting rate to be alarmingly fast. The difference in rate between specific instances is related to the relative intensity of all these factors.
Now, the reduction in EL is related to the severity of fretting corrosion, and research work is ongoing to establish a mathematical relationship to allow the accurate prediction of the loss of fatigue life as a function of fretting severity. The fact remains that there is a plentiful supply of empirical data showing this loss of fatigue strength.
There is also plentiful evidence that the rate of fretting can increase dramatically when vibratory loading is added to the design conditions which produce fretting. This system is subjected to a substantial application of vibration energy because of proximity of a system resonant frequency to the engine excitation frequency, which can increase the instantaneous stress level on the shaft by as much as 40%.
Failed shafts which we have analyzed show unarguable evidence of fretting in the highly-loaded areas of the shaft where other components (bearings and sleeves) have interference-fits on the shaft. This implementation is one of the textbook causes of fretting.
The following pictures (high-quality, slow-loading) show the evidence of the failure of 30 and 35mm secondary shafts in bending fatigue, where the fracture origination site was a fretted area of the shaft surface. The first few pictures are from a failure in the 30 mm, double-bearing secondary. This particular failure is such a textbook example of fretting fatigue, and the parts so clearly show the evidence, that extra space is given to this failure.
Figure 1 shows how the 30mm shaft typically fails, approximately halfway down inside the inner race of the upper bearing of the pair.
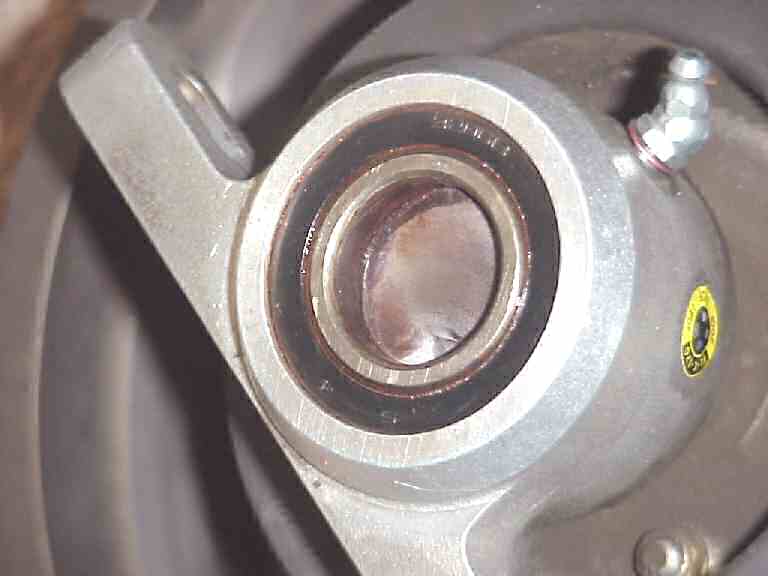
Figure 1
Figure 2 shows the broken stub of the secondary shaft. Pointer "A" shows the failure initiation crack. The failure-plane discoloration is from corrosion and contamination seepage during the relatively long fracture development phase.
Pointer "B" shows some of the "beach marks" which are classical indications of bending fatigue failure. As the cracked shaft continues to be stressed, the crack progresses across the section. The amount of material carrying the (same) load is decreasing, so the stress (at the same load) is obviously increasing. That causes the failure to progress across the section at an ever-increasing rate.
Pointer "C" shows the area of final fracture. Notice it is much more jagged than the progressive fatigue section, indicating an instant fracture when the unbroken section area had reduced to the point that the applied stress exceeded the ultimate strength of the material.
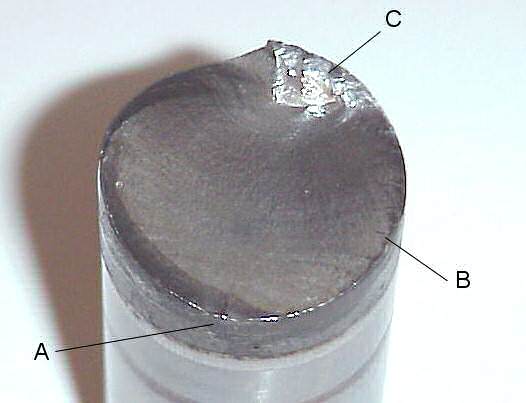
Figure 2
Figure 3 is a picture of the same section taken at much higher magnification, illustrating more clearly the nature of the failure section.
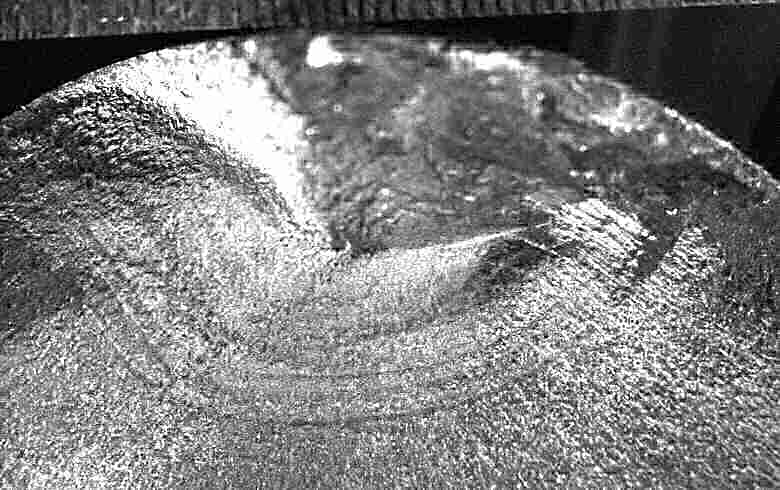
Figure 3
Notice in the first picture that there is a blackened band around the OD of the shaft, which extends about 3/8 of an inch below the fracture plane. Recall that the failure occurred inside the inner race of the upper bearing. This band shows evidence of severe fretting between the shaft surface and the inner race. This is a major contributor to the failure (discussed further below).
Figure 4 shows the metal loss in the fretted area on the OD of the shaft.
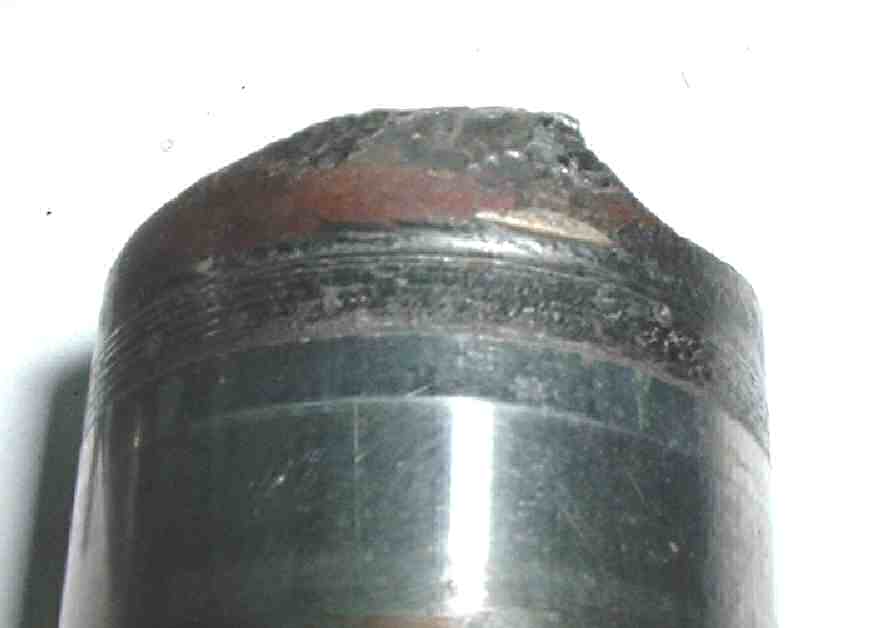
Figure 4
Figure 5 shows the mating fretted area on the ID of the upper bearing inner race and the corresponding metal loss.
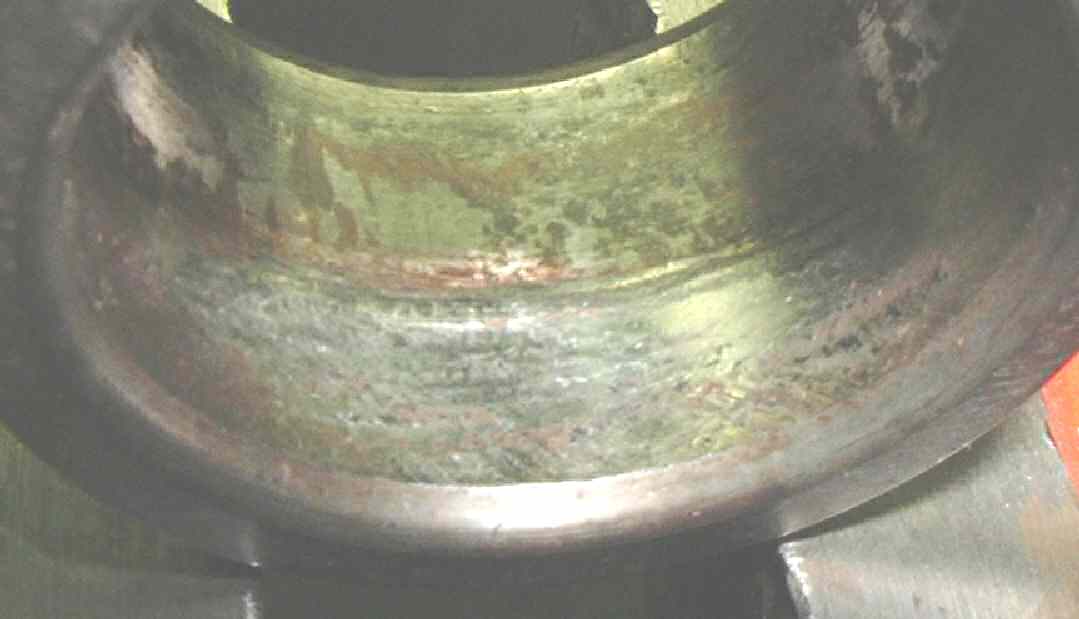
Figure 5
The next few pictures show the fretting which occurs on the 35mm secondary shaft, ultimately leading to the type of fatigue failure shown here. This shaft broke, in flight, 55 hours after it was installed, brand-new, by a meticulous A&P builder.
Note that the sources of fretting in the 35mm shaft are slightly different from those in the 30mm.
Figure 6 shows a close-up of the upper portion of a failed 35mm shaft. Whereas the worst fretting (and thus, the failure) on the 30mm shaft usually occurs above the upper bearing (for obvious reasons), the 35mm shaft typically fails below the bearing, from fretting sites near the lower edge of the spherical bearing inner race or (as in this case) at the juncture of the secondary shaft and the pressed-on sleeve which Rotorway uses to run the lower seal against.
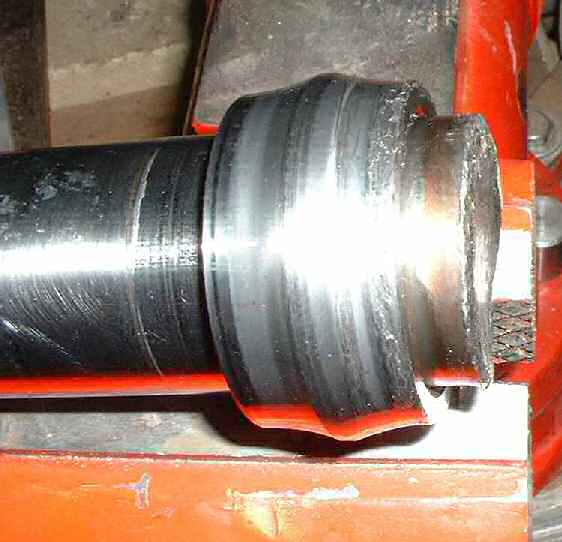
Figure 6
It is also interesting to note that there was evidence on this shaft that the spherical bearing had been installed onto the shaft too far, then pressed upward to get to the correct location. Because of the softness of the shaft, there was considerable scoring on the shaft surface (shown to the left of the bearing race) and a pronounced ridge of scraped material above the bearing (to the left of the inner race), clearly shown in the picture. It appears that this scoring did not contribute to the failure, but certainly could have if the fretting had not weakened the shaft as it does.
Figure 7 shows the broken stub of the secondary shaft after the bearing inner race was removed (cut off, not pressed off). The ridge of scraped metal is visible at the left edge of the picture. What is more significant is the fact that there is evidence of significant fretting under the edges of the bearing race. That is clear evidence that fretting occurs under the bearing as well as under the pressed-on sleeve. In this case, the fretting under the sleeve was progressing at a faster rate. It might be different in other installations. In fact, the ProDrive website has some other photos of fretted belt-drive shafts.
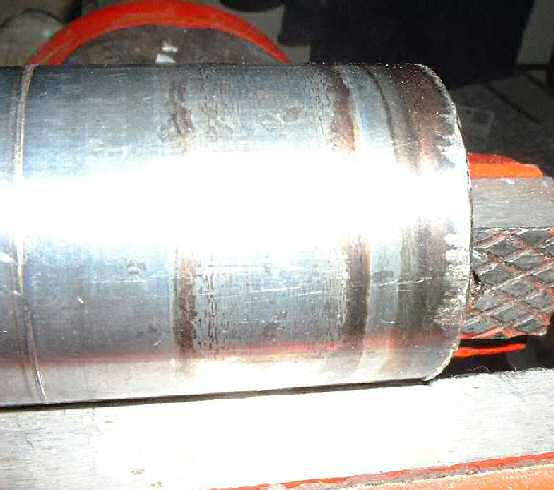
Figure 7
Figure 8 is of the same shaft stub from a different angle. It too shows the scraping ridge and the fretting under the bearing.
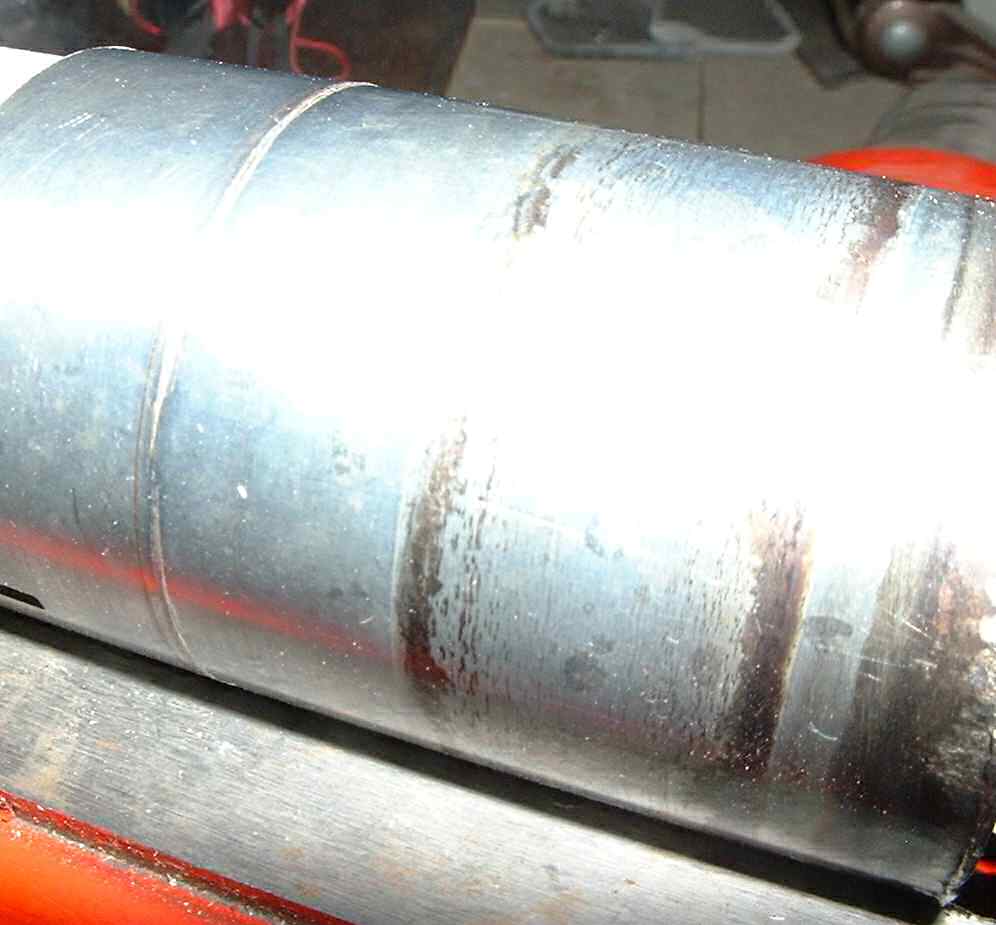
Figure 8
Figure 9 shows the fracture face, after hardness tests had been run on it. The black line surrounds a cluster of Rockwell tester indent marks. There is not much information to be gleaned from the fracture face in this instance because it was so badly deformed and battered during the failure incident. However, again, it shows the degree of fretting which occurs under the spherical bearing in toothbelt drive application.
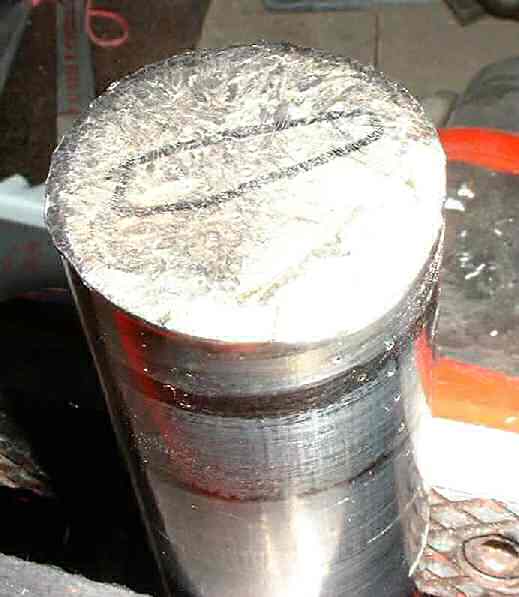
Figure 9
Although the loads, thus the deflections, are greater with the ProDrive™ belt system, we think that the same fretting is occurring under the bearing in chain drive installations. The damage is probably progressing at a slower rate. How fast or how slow depends on a lot of factors, including the average MAP that any particular ship operates at (remember, in the chain drive, the lower the applied power, the lower the fatigue loads on the secondary shaft.)
Again, this picture shows the severity of fretting under the bearing on the 35mm shaft.